Iris: AI-driven Business Data Insights Experience
From Weeks to Minutes, Transforming EA's Data-Driven Decision Making
Team
As part of the core Data & Insights product team, I collaborated with a 3 product managers, 11 software engineers, 2 researchers, 3 data scientists, and one platform architect.
Responsibilities
- End-to-end product design from research to implementation
- Assisted user research across 4 personas and 8+ teams
- Established design principles and product strategy
- Created high-fidelity designs and functional prototypes
- Partnered with Product and Engineering on roadmap
Overview
From Weeks To Minutes
Iris is an AI-powered insights platform thath cuts the wait for critical data from weeks to minutes, instantly analyzing all of EA's massive data platforms (Sales, Finance, Marketing, etc.). This speed empowers leaders to make faster decisions, capturing revenue and optimizing performance across the business.
The Problem
Generating complex business insights is too slow and prone to error
Data is fragmented across various EA teams due to siloed ownership, severely hindering timely decision-making and analysis. For example, when the Pricing team needed to analyze promotional effectiveness across 50 titles and 8 regions, it required: 5 analysts working for 3 weeks, data from 4 different systems and manual reconciliation of inconsistent numbers. By the time the analysis was complete, the promotional window had closed.
Before Iris, data-driven decisions moved at a crawl:
The cost? Missed revenue opportunities, slow market response, and frustrated teams across Finance, Marketing, HR, and Sales.
Iris v1 was the first attempt at solving this problem and was modeled after ChatGPT but failed to accommodate diverse personas and workflows.
After extensive usability testing, four main core pain points became obvious:
- Writing effective prompts required hand-holding
- 20+ second latency broke conversational flow
- No manual configuration for different workflows
- Ad hoc requesters vs. analysts had different needs

The old Iris v1 home page
To address these challenges, we conducted extensive user research to understand what teams actually needed from a data platform.
Design Approach
Make Data Actionable
As a user research foundation we conducted interviews & surveys with Pricing, Forecasting, and People Experience teams that revealed three non-negotiable requirements:
Trust and Accuracy
Leaders need 100% accuracy for high-stakes decisions. We implemented data lineage, disambiguation workflows, and explainability features.
Speed and Performance
Real-time insights are the most valuable feature. We reduced response time (20s → 15s) and enabled async exploration through Stories.
Collaboration and Access
Data must be accessible and shareable across teams. We built Stories as persistent, collaborative canvases.
These principles guided our redesign around 4 core features that work together as a complete user workflow.

The Iris solution architecture
Guided Prompt Experience
Remove the blank box paralysis
Before, Iris v1 struggled with query ambiguity, leading to incorrect answers or failure to respond. The system lacked a mechanism to validate its interpretation, undermining user trust and creating a frustrating rephrasing loop for complex questions.

The Iris box paralysis
One of Iris's key features is AI-generated insight summaries — the platform analyzes data patterns and produces written explanations of what's significant. But we had a trust problem. The AI would produce confident-sounding summaries that were actually based on insufficient data, or presented correlation as causation. Users had no way to tell when to trust what they were reading.
Before jumping to solutions, I mapped the root causes. I identified five types of uncertainty that could undermine an insight — from not having enough data points, to patterns that might not persist over time. This taxonomy became our diagnostic framework.
The trust system helped automated generation, and also added transparency layers at two critical moments — before the query runs, and after results arrive. Previously, the Guided Prompts showed data quality, validated scope, and set confidence expectations upfront. The new Confidence System shows reliability, explains limitations, and offers paths forward. The insight here is that confidence should be set at query time, not revealed as a surprise after.

The Iris confidence system
Now, the prompt validation builder manages ambiguous queries and provides transparency into Iris's application of context and business rules. This functionality delivers enhanced feedback, allowing users to refine questions and correct any answer inaccuracies.

The Iris disambiguation builder
The new guided experience surfaces limitations proactively so users understand scope constraints before interpreting results. Surface limitations proactively so users understand scope constraints before interpreting results.

How was this calculated?

Data Caveats & Limitations
Key Design Principle: Confidence is set at query time, not revealed as a surprise after. Users who see 'Medium Confidence' before running a query aren't surprised when results confirm it. This builds trust, even when confidence is low.
Key Capabilities
- Select domains by scoping queries to relevant data
- Use context-aware question templates as suggested prompts
- Build prompts with structured fields for complex queries
- Receive real-time validation with feedback before submitting
Impact
78% of users who struggled with prompts can now get accurate answers on first try.
AI Companion
Natural language data access
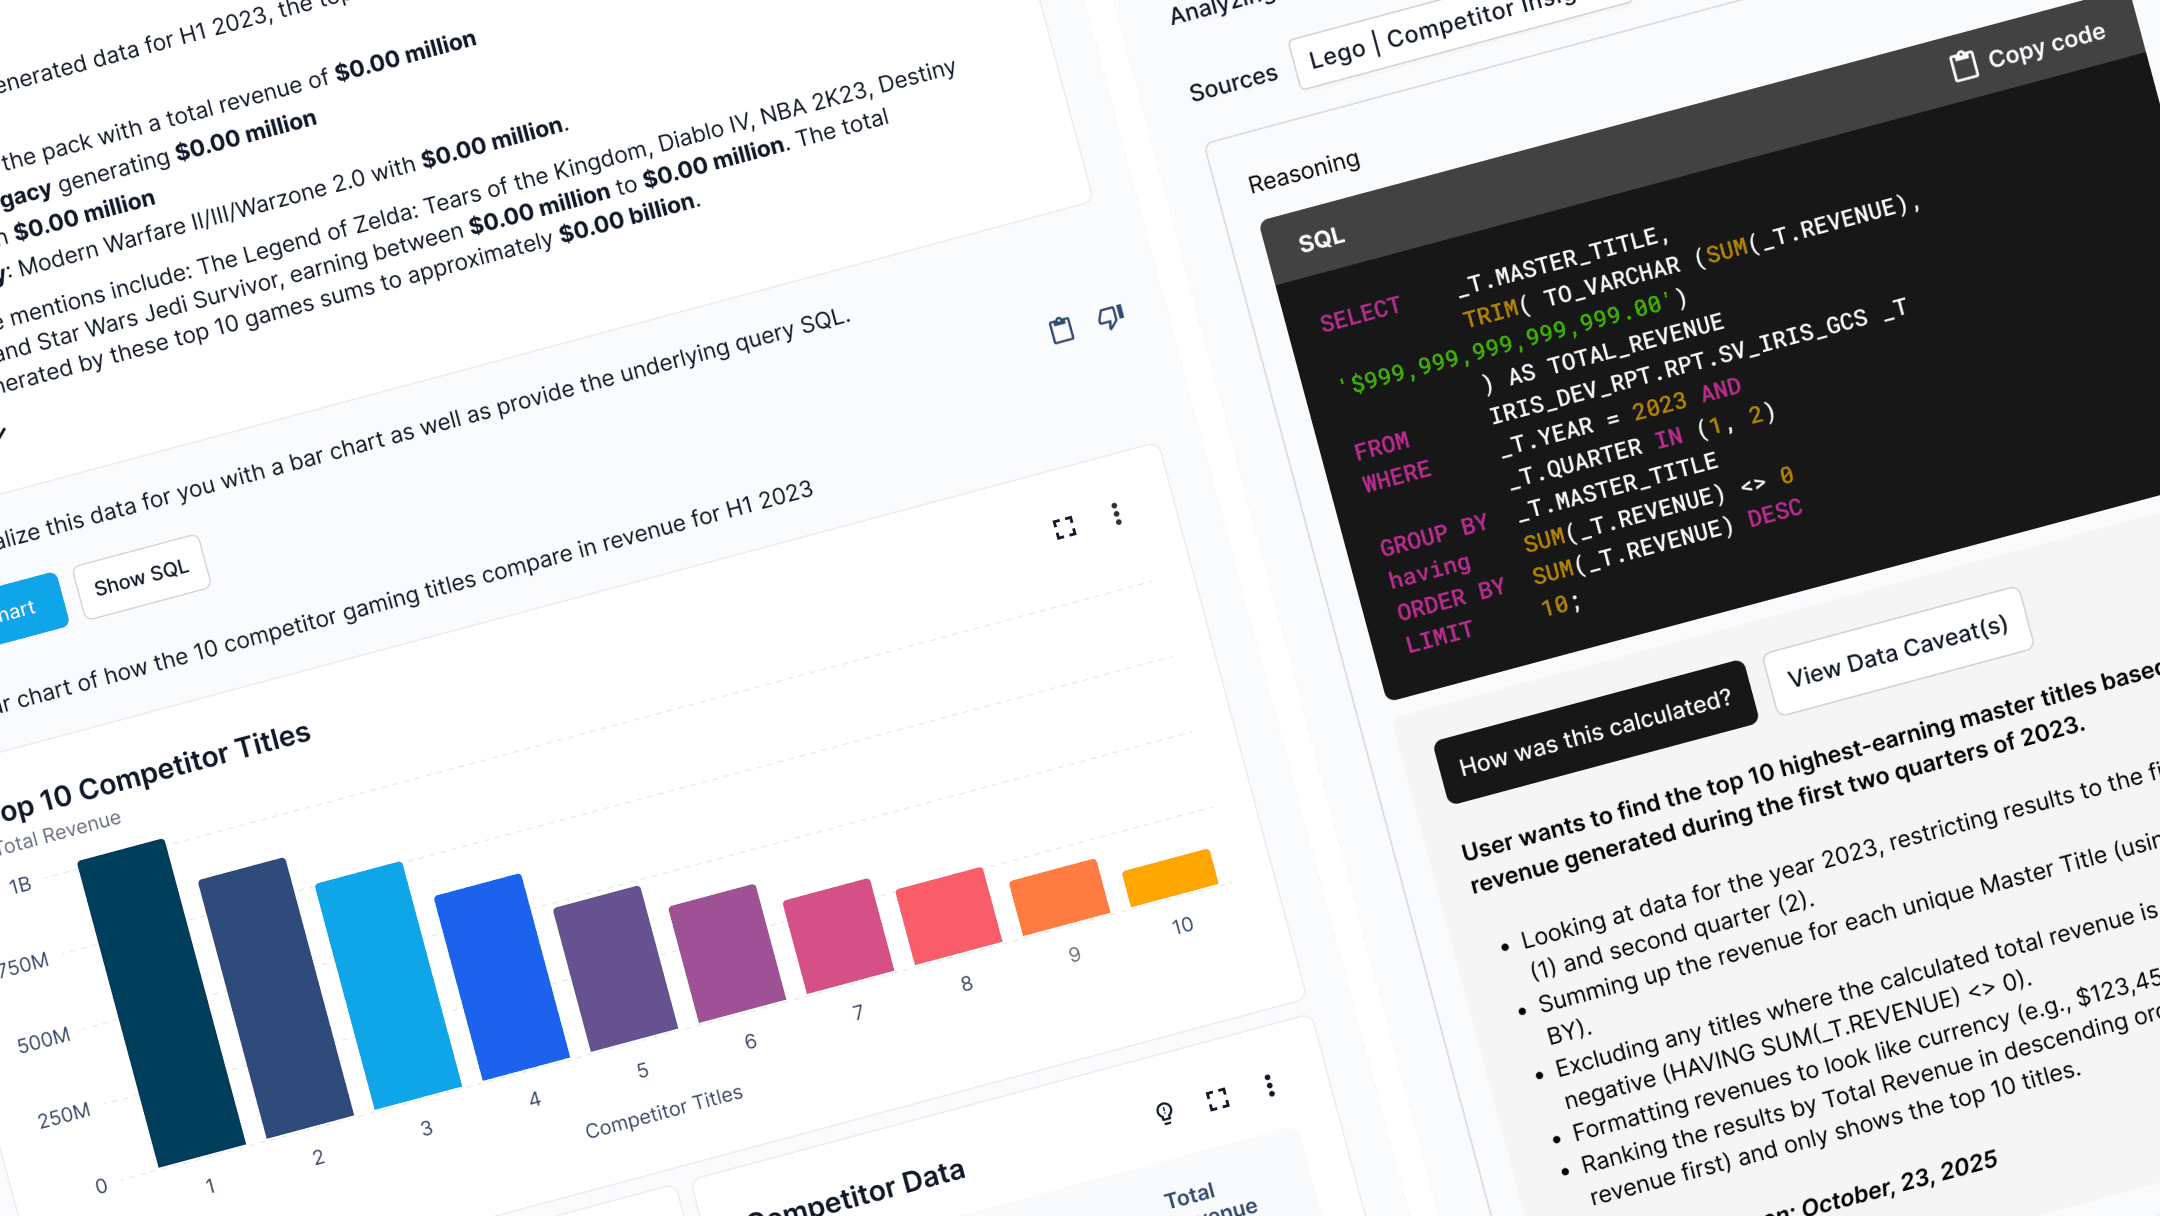
The Guided Prompt Experience scaffolds user input, while the AI Companion processes that structured input to deliver accurate results. Together, these layers enable anyone to access enterprise data, from executives checking metrics to analysts building complex reports.

The Iris nlp analysis
Quickly create tables, charts, and summaries for easy interpretation. The conversational nature of AI allows for ongoing adjustments and refinements before finalizing the data.

The Iris nlp companion

The Iris nlp companion
Key Capabilities
- Analyzes natural language from various data sources to extract meaningful insights.
- Implements business context and validation rules to ensure accuracy.
- Quickly creates tables, charts, and summaries for easy interpretation.
- Allows for ongoing adjustments and refinements before finalizing the data.
Impact
Users can access data without needing technical skills, making insights available to all teams. No SQL required. No waiting for analysts. No errors.
Story Composer
Turn data into narrative
Before, chat responses were ephemeral (lost in scroll), users had to recreate reports from scratch each time, and there was no collaboration or sharing.

The Iris chat v1
Stories now exist as persistent canvases. The Story composer offers persistent, editable canvases with a drag-and-drop interface for organizing content. The Story composer features live data refresh for current information, and allows sharing with teams through adjustable view/edit permissions.

The Iris companion stories
Key Capabilities
- Build and organize with a simple drag-and-drop interface to structure your content.
- Narrative components allow you to combine generative summaries, custom text, dashboards, and visualizations into one cohesive report.
- Live data that instantly refreshes saved analyses to ensure reports are always backed by the latest data.
Impact
Transformed ephemeral chat into persistent work products that teams build, share, and update over time.
Intelligent Charts
Make every visualization explorable and insightful
The Chart Highlights feature automatically elevates visualizations by providing visual cues that highlight significant data points, trends, or anomalies. This dramatically improves storytelling by making data immediately informative, as it automatically emphasizes key events and changes relevant to the narrative the user is building.

The Iris hover data point
The Chart Drill Down feature enables users to instantly go deeper into their analysis. Users can drill down on any chart point to explore the underlying data attributes.

The Iris drilldown chart

The Iris highlight chart
Key Capabilities
- The automatic highlighting feature allows AI to surface significant trends and anomalies.
- You can click on any point to explore the underlying data through contextual drill-down.
- Visual annotations provide explanations for why something is notable.
Impact
Users discover insights faster and understand the 'why' behind data patterns without analyst assistance.
Complete User Workflow
These features work together to support the complete insights journey:.
- Users start with GUIDED PROMPT EXPERIENCE to formulate questions
- The AI COMPANION processes queries and delivers instant answers
- The STORY COMPOSER lets them build narratives and share with teams
- The INTELLIGENT CHARTS enable deep exploration and discovery
What was once a weeks-long, multi-team effort is now a self-service workflow that anyone can complete in minutes.
Business Impact
$13.2M+ Revenue Uplift
- •$1.2M loss prevented (Pricing)
- •$10-14M projected (Modeling)
- •$2M achieved (Competitor Analysis)
$6-7.7M Cost Savings
- •$2-4M saved (T&E Analytics)
- •$3.5-3.7M efficiency (People Experience)
Productivity Gains
- •52% reduction in analyst tickets
- •Data prep time: 2 hours → 15 minutes
- •Abandonment rate: 65% → 38%
Key Learnings
One interface cannot serve all personas. Therefore, I developed adaptive workflows that change based on user goals, whether they are browsing, building, or validating.
It was recognized that a 20-second latency cannot be eliminated, so I designed for interrupted attention through Stories that maintain context across sessions.
AI requires transparency to build trust, which is why data lineage and the ability to 'explain this answer' have become essential for adoption, rather than just nice-to-haves.